

A magazine where the digital world meets the real world.
On the web
- Home
- Browse by date
- Browse by topic
- Enter the maze
- Follow our blog
- Follow us on Twitter
- Resources for teachers
- Subscribe
In print
What is cs4fn?
- About us
- Contact us
- Partners
- Privacy and cookies
- Copyright and contributions
- Links to other fun sites
- Complete our questionnaire, give us feedback
Search:
I am legend

We’ve all seen the movies. A virus mutates and rapidly spreads. Will there one day be a real Will Smith – a real hero, ‘I am Legend’-style? The ultimate last man standing?
Outbreaks of disease spread in unexpected and poorly understood ways, and their growth can be explosive. They can kill large numbers if they do, and diseases don’t respect country boundaries of course. A disease starting in the UK could kill anywhere in the world. We can’t teleport ‘Jumper’-style but we can easily jump between continents in a matter of hours, taking disease with us. The last big flu pandemic that started in Hong Kong in 1968, killed 34,000 in the United States. The "Spanish flu" of 1918, which this time started in the US, killed around 17 million in India. And that was before airliners and jet-set holidays for all.
To stop the spread of an epidemic before it gets out of control, health workers must find out who infected patients have been in contact with – they must identify the next wave of potential disease transmission. If these contacts have themselves become unwell, then the disease is still spreading. You still have a problem!
The World Health Organisation (WHO) have the crucial task of managing outbreaks of infectious diseases like Ebola and Marburg Haemorrhagic Fevers or Bird Flu. To do that they could benefit from computerised help: the Field Information Management System (FIMS) is a tool developed by the Alert and Response Operations team at the WHO to do just that. WHO workers use FIMS to track cases. They visit people who have been in contact with the infected people and FIMS helps manage the follow-up, the tests, the samples, the reports. The management of an epidemic generates a huge amount of this kind of difficult-to-coordinate administrative paperwork. Painstaking detective work is then needed as health workers collate all of the information they gather each day, and make decisions about priorities for the next day. With the huge amounts of data involved it can be hard for the health workers to see the wood for the trees. This is where computer science in the form of visualisation research can help.
Conrad Hughes and Stuart Anderson at Edinburgh University School of Informatics are working on ways to visualise the spread of epidemics. Florence Nightingale showed that pictures could help persuade decision-makers but their work shows that turning the data into simple pictures can also make it easier for health workers to understand how a disease is spreading in the first place.
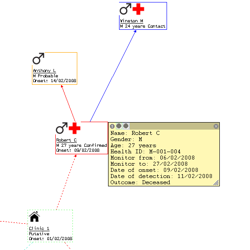
Transforming the data into simple graphs replaces hours of tedious labour on the part of hard-pressed field teams by a few seconds of computation...as long as an appropriate way to visualise all that data is found. By representing the people (and places) as nodes (the points) in a graph, with the lines between them showing who's been in contact with whom, the spread of the disease can be followed. Workers can then easily see how each case connects so that people who may have been infected can be treated in time. It’s also simple to spot patients about whom not enough is known. That's crucial so that information can be gathered quickly about the people they might have infected.
Building on experience during outbreaks of Ebola in Uganda and Marburg in Angola, there is now interest in the system from a whole range of governments who may one day need to use a system like this to manage an outbreak in their own countries – including Britain.
Spanish Flu disappeared on its own within 18 months. Future epidemics may not materialise in the first place because we know how to control them, due to the hard work of health workers and some cunning ways to visualise data. You may not need to Be Legend after all.